Largest Contentful Paint (LCP) is a web performance metric that measures when the largest element of a given web page becomes visible in the user’s browser.
If it takes longer than expected to load the crucial element of your content, your website’s visitors may get frustrated and leave, which will be reflected in high bounce rates and poor LCP score.
Why is that dangerous? Because similarly to other Core Web Vitals metrics, LCP directly impacts user experience. And how your users feel when exploring your website can influence your conversions and translate into your revenue.
In 2021, addressing the LCP-related issues became crucial also for your website’s SEO as LCP has been introduced as a Google ranking factor in the Page Experience update.
In this article, I covered a step-by-step guide to optimizing the LCP for better render performance of your pages and improved user experience.
What exactly is Largest Contentful Paint?
Largest Contentful Paint is a Core Web Vitals metric that calculates how long it takes for a page’s largest element to be rendered in a user’s viewport.
According to Google, “(…), an element can only be considered the largest contentful element once it has rendered and is visible to the user.”
In other words, LCP is measured from the moment the largest element on a page starts loading to its full visibility to users.
LCP is a user-centric metric because the largest element in the viewport is usually the most important but also one that best reflects the page load speed.
The LCP element must be located above the fold, so it’s visible to a user without scrolling.
Examples of main content that’s often the LCP element include:
- A hero image,
- a text paragraph,
- an image carousel,
- video thumbnail, etc.
Don’t confuse Largest Contentful Paint (LCP) with First Contentful Paint (FCP)
Largest Contentful Paint and First Contentful Paint are both web performance metrics measuring the time needed to render the content of a given web page. However, how they differ is significant.
The difference between LCP and FCP lies in the element they focus on during the page load. Largest Contentful Paint measures the time needed to load the largest element of a page, First Contentful Paint focuses on how long it takes for the first element on that page to be fully rendered.
And the important thing is that the first element that users see during the loading process may not necessarily be the largest one, as, for example, a logo or background image.
Also, another difference between these two is that First Contentful Paint isn’t considered one of the Core Web Vitals metrics. But it doesn’t mean FCP isn’t worth optimizing at all.
On the contrary, First Contentful Paint may be a crucial metric to improve. How fast the first element of your page becomes visible to users may influence if they are willing to wait for the largest element to show in their viewports and stay on your page.
Also, First Contentful Paint works as a starting point to measure Total Blocking Time (TBT) – a metric reflecting your page’s responsiveness during the page load.
Is Largest Contentful Paint important for SEO?
As the Page Experience update went live in June 2021, LCP, together with Cumulative Layout Shift and First Input Delay, is now used as a ranking factor in desktop and mobile search.
The reason Google chose LCP as a relevant SEO metric is that it directly influences user experience. The loading of the biggest element on a page determines how quickly the user will be able to view its contents and interact with it.
Additionally, LCP correlates well with user behavior metrics. If you’re stuck improving your conversion rates, time spent on page, or any other behavior metrics that have a direct impact on your business, improving your render performance through reducing your LCP score is bound to help.
What is a good LCP score?
Because LCP measures time to render, the lower your score is, the better because your users will see the essential content sooner.
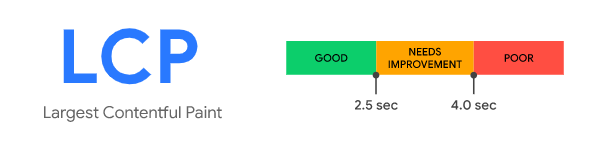
That being said, these are the thresholds that Google specified for LCP values:
- Good – LCP of 2.5s or less,
- Needs improvement – LCP between 2.5s and 4s,
- Poor – LCP of 4s or more.
So if you want to “pass” the Core Web Vitals, you need an LCP score of 2.5s or less for 75% of all your page views.
How is LCP calculated?
Details about the largest image or text paint visible before a user interacts with a page are retrieved through the Largest Contentful Paint API.
The API gives webmasters the opportunity to look into how their pages are loaded and rendered.
Let’s analyze how it works to determine and calculate the largest contentful element.
Elements usually considered LCP
Only some content types can be considered as candidates for LCP, namely:
- <img> elements,
- <image> elements inside SVG documents,
- poster images for <video> (placeholders shown when the video is loading or before the user hits “Play”)
- <background-image> elements,
- text nodes, such as <p>.
This is because the LCP API depends on the Element Timing API to track the rendering timestamps of the largest elements, and Element Timing only supports the above-mentioned formats.
Determining an element’s size
The process of choosing the largest element to report by the algorithm is complicated, and there are some caveats you should know about:
- For elements that extend outside of the viewport, only the portion visible in the viewport is considered,
- For images that are resized, the size that’s considered is either their intrinsic size or the visible size – whichever is smaller.
- CSS margin, padding, or border doesn’t affect the element size,
- For text elements, the smallest rectangle that fits all text nodes is considered.
Tracking the largest element
As a page loads, its largest element may change as the load progresses through its stages.
The algorithm choosing the largest element looks at all content elements rendered in the viewport throughout the load cycle.
When the first frame is loaded, the browser dispatches the largest-contentful-paint PerformanceEntry.
As new elements are being loaded and the algorithm finds new, larger elements in the viewport, new PerformanceEntry objects are dispatched.
Crucially, an element has to be rendered and visible to the user to be viewed as the largest contentful element.
Measurement stops as soon as the user interacts with the page that’s being loaded.
Other things you should know about calculating LCP
- For images, render time is the time of the Paint that immediately follows the image’s onload. This means progressive loading of images doesn’t help with reducing LCP.
- Changes to an element’s size or position do not generate new LCP candidates. Only the element’s initial size and position in the viewport are considered.
- If LCP is a text element, the earliest font load is considered. So the font can update, and LCP render time stays the same.
- If you’re using CSS font-display: block, the measurement waits until the text is visible.
The most common causes of poor LCP score
Your LCP score can be negatively affected during the entire process of loading your page.
However, to be specific, a poor LCP score is typically caused by the following:
- Slow server response times (which can be measured by the TTFB metric),
- Render-blocking CSS or JavaScript files,
- Slow load times for resources on the page,
- Slow client-side rendering.
Addressing the aspects above is crucial to speed up the LCP loading and get your LCP score on the right track.
Let’s dive into the process of LCP optimization by learning how to measure LCP and find the LCP element.
How to measure Largest Contentful Paint?
You can use both lab and field data to measure your site’s LCP, and both types of data have their uses:
- Lab data is collected using predefined settings (device, location, etc.), and it works best for debugging and in test environments,
- Field data is gathered from real users accessing your website and shows you their actual experience.
Lab data tools
The following tools can help you track your LCP measured in a lab:
Lighthouse
Lighthouse measures web performance for a page and generates a report containing a breakdown of all the metrics and how they can be improved. For LCP, you will see the page’s score and suggestions for what you can do to improve it and which elements the improvements could apply to.
WebPageTest
WebPageTest gives you a detailed analysis of the selected page, including a specific report for each of the Core Web Vitals metrics. You can view how your LCP loads step by step, get all the information about the LCP event and see which page element is considered LCP, which can help you focus your optimization.
The specifications for the test can be set up in various ways – you can adjust the location, connection speed and type, browser, etc. This tool is definitely more advanced and lets you conduct a more thorough analysis of the metrics.
Chrome DevTools
Chrome DevTools include many features for analyzing the page’s performance and processes taking place on it.
You can go to the Performance tab and tick the box containing Web Vitals. After reloading, you will see all the metrics in action on the page. The recording will show both the FCP and LCP.
To quickly see the metric scores, you can view a Core Web Vitals overlay of the three metrics by navigating to the Rendering tab.
Field data tools
Google uses your website’s field data collected from Google Chrome users to determine an LCP score, which is why I recommend focusing on these tools to measure it.
Field data is stored in Chrome User Experience Report (CrUX), which means you can optimize your site based on the very same data Google is using for ranking.
CrUX data can be accessed via the following tools:
PageSpeed Insights
Google’s PageSpeed Insights is one of the key tools to use for analyzing Core Web Vitals. It provides both lab (Lighthouse) and field (CrUX) data on mobile and desktop devices. It shows an overview of the real-world data and includes useful recommendations for improving each of the metrics.
CrUX Report API
You can use the API to access CrUX data, representing the experience of real-world Chrome users on the web.
This way of accessing the dataset gives developers and webmasters a quick and comprehensive solution to gain insight into how users are experiencing the pages and how to make it better with respect to each CWV metric.
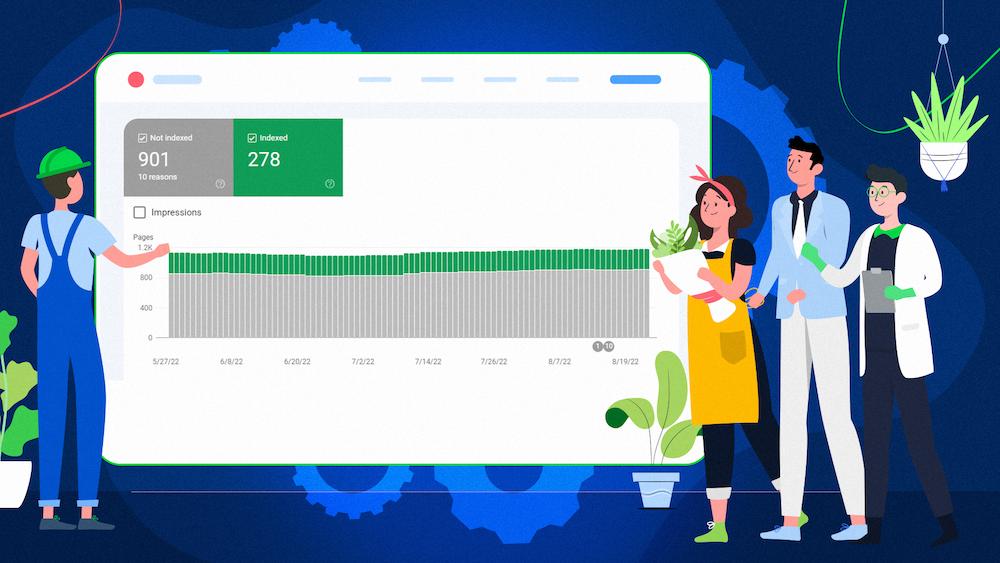
Google Search Console (Core Web Vitals report)
The Core Web Vitals report is based on data from real users. It shows a chart for both mobile and desktop devices with a breakdown of how many pages appear as good, need improvement, and poor.
You can open each report for a detailed overview of URLs with the respective scores. After selecting a URL, you can see details of how each metric scores. From that view, you can go to PageSpeed Insights to find suggestions for improvements.
The Web Vitals Chrome extension
This extension measures the Core Web Vitals metrics and provides feedback on them. You can see if your LCP passes the required thresholds and see the exact scores.
The extension shows a comparison between the local Core Web Vitals experiences on your pages with real-user data via the Chrome UX Report (CrUX) API.
Google’s BigQuery
You can also use BigQuery to access the raw CrUX data and view Core Web Vitals performance results for sites with specified connection speeds and device types, giving you the option also to track the metrics over time.
Read this article to learn exactly how you can write queries in BigQuery to access CrUX data.
Google Data Studio
Another way to access CrUX data is through Google Data Studio. You can use it to create a CrUX dashboard that will provide you with a visualization of the relevant data.
Go through this guide on web.dev to find out how to use CrUX data with Data Studio.
JavaScript API
As with other Core Web Vitals, you can use the LCP API if you have some experience with JavaScript. This allows for more granular control over what is being measured but also has some drawbacks.
Here is how the data that the API reports differ from how LCP is calculated:
You can also use the web-vitals JavaScript library, which may help you work around those inconsistencies.
How to find the Largest Contentful Paint element?
Optimizing LCP comes down to finding out which element is your LCP element and making it render faster in the user’s browser.
The first step you need to take is to determine which LCP candidate triggers the final largest-contentful-paint entry and decides your LCP score.
Here’s how to find the LCP element using Google Chrome:
- Open the page you want to find the largest element for.
- Open Chrome DevTools (Ctrl+Shift+I on Windows, Command+Option+I on Mac).
- Navigate to the Performance tab.
- Click Record (or Ctrl+E – this will start profiling the performance of the page you have open).
/6-what-is-largest-contentful-paint.jpg)
- Reload the page using Ctrl+Shift+R (always use this instead of F5 when working on web performance – this method makes the page reload without using the cached assets).
- Stop recording in DevTools and look for LCP in the Timings section.
/7-what-is-largest-contentful-paint.jpg)
- Hovering or clicking on LCP will show you the largest element that determined your LCP score.
/8-what-is-largest-contentful-paint.jpg)
How you should proceed with optimizing your LCP depends on the type of element it is.
If it’s an image and your server isn’t to blame, proper compression will often already put you in the “good” LCP bracket.
With text, ensure it’s placed in the initial HTML response the browser gets from your server.
Below, you will find specific guidelines on how you can deliver your LCP quicker.
How to speed up the Largest Contentful Paint loading?
Optimize your server-response time
If your server reacts slowly to the requests sent by the browser, your LCP will be affected.
A slow server response may be caused by the following:
- having to run complex computations before responding to the browser,
- dynamically generating the page server-side as opposed to serving a static page,
- the server being overloaded with requests and unable to timely handle them all.
Here are some ways to fix slow server performance:
Choose a faster hosting service
Faster hosting can improve many aspects of your page’s performance, so it’s good to consciously choose the right hosting service for your site. For example, consider finding a solution with servers located close to where the majority of your users are.
Use a CDN
A CDN (Content Delivery Network) can help deliver your assets faster to users located in different parts of the world.
If you’re using a single server, a user on the other side of the world will have to wait longer until their browser can render your content. Using a CDN, you host your assets on multiple servers across the globe, and you’re able to deliver content sooner to users anywhere in the world.
Enable caching
Caching is a technique of storing copies of assets after they were downloaded once so that they don’t have to be downloaded each time the browser requires them. It is vital if you want a performant site, and taking advantage of caching will be beneficial to your performance way beyond just improving LCP.
Establish third-party connections early
Your server may need to make third-party connections which, especially when they are needed to display crucial content, can negatively impact your LCP score.
The best solution to establish the connection early is to use rel=”preconnect” in your page’s code. Additionally, as some browsers don’t support preconnect, use rel=”dns-prefetch” as well as a fallback.
Optimize render-blocking resources
The process of loading a web page begins when the browser starts parsing the initial HTML downloaded from the server.
Parsing the HTML, generating the DOM tree based on it, and finally rendering the page is paused whenever the browser needs to load external CSS or JavaScript assets.
That’s why these assets are known as render-blocking.
Optimizing render-blocking resources is a complex process that involves the following options:
Defer or inline non-critical JavaScript
JavaScript files are particularly likely to impact the LCP score negatively.
If you assign a deferred status to non-critical JS scripts, the browser can parse the HTML and build the DOM before loading and processing JS. Consequently, the render-blocking impact of JS is reduced, and a better LCP score can be achieved.
You can also inline your JS in the HTML to prevent rendering from being delayed and to run it as early as possible in the page load.
Inline or reduce critical CSS files
Your critical CSS code needs to load as quickly as possible. One of the things you can do to make your CSS load faster is to inline the CSS into the HTML.
Alternatively, if the CSS is too large, you can reduce its size to make it smaller than the LCP element. To reduce the size, you can:
- Defer non-critical CSS,
- Minify (remove extra spaces, indentation, and comments) and compress CSS,
- Remove unused CSS files.
Compress images
Image compression is the art of maintaining a balance between the image quality and the size of the asset.
Since, for most sites, the LCP element is an image, optimizing your images is critical to achieving a good LCP score.
You can also adjust your images by:
- Serving optimal image sizes for the purpose of your image,
- Using appropriate, modern image formats.
Compress text assets
Any text files needed to render your page (HTML, CSS, and JavaScript) can be compressed using Gzip, Brotli, or other compression methods to minimize their delivery size and lower your LCP score.
Are you struggling with your LCP score? Check out our Website Performance services. We can help you improve your web performance.
LCP vs. other rendering metrics measuring performance
LCP is one of the rendering metrics, meaning it captures the moment in time when a particular portion of a web page is rendered in the user’s browser.
Though Google chose to include LCP in the ranking algorithm, there are other rendering metrics that you can optimize for your website:
- Load Event fires when the whole page has been loaded,
- First Paint marks the point when the browser renders anything different from what was previously on the screen,
- First Contentful Paint marks the point when the first bit of content is rendered,
- First Meaningful Paint shows when the essential content is rendered (chosen based on different heuristics when compared to LCP),
- DOMContentLoaded fires when the initial HTML has been fully loaded and parsed. The difference between DCL and load is that external resources like pictures don’t need to be loaded for the DCL to occur.
While all these metrics can prove useful when you’re optimizing your site, they aren’t the best options to specifically measure how fast the main content of a page loads and becomes visible to users.
Older metrics like load or DOMContentLoaded are not good because they don’t necessarily correspond to what the user sees on their screen. And newer, user-centric performance metrics like First Contentful Paint (FCP) only capture the very beginning of the loading experience. If a page shows a splash screen or displays a loading indicator, this moment is not very relevant to the user.
LCP comes with some advantages and improvements – here is how they are explained in the document defining the LCP API:
Developers today don’t have a reliable metric that correlates with their user’s visual rendering experience. Existing metrics such as First Paint and First Contentful Paint focus on initial rendering but don’t take into account the importance of the painted content, and therefore may indicate times in which the user still does not consider the page useful. LCP aims to be a new page-load metric that: The largest Paint during the loading process of the page is likely to signify a meaningful event from the user’s perspective. It is, therefore, something we want to expose by default to developers, enabling performance teams, analytics providers, and lab-based measurement tools to collect those metrics without requiring extra annotation work by the folks creating the content itself.
Read our articles about other web performance metrics:
Wrapping up
The Largest Contentful Paint metric is a deceptively simple but effective way to measure when key content is displayed in the user’s viewport. With all the other metrics available, we are getting closer to a consistent, universal way of accurately measuring website performance with the user experience in mind.
For more insight into LCP, you can watch what Onely’s Bartosz Goralewicz has to say about LCP:

Hi! I’m Bartosz, founder and Head of Innovation @ Onely. Thank you for trusting us with your valuable time and I hope that you found the answers to your questions in this blogpost.
In case you are still wondering how to exactly move forward with your organic growth – check out our services page and schedule a free discovery call where we will do all the heavylifting for you.
Hope to talk to you soon!