Total Blocking Time (TBT) is a web performance metric that measures for how long the main thread is blocked from responding to user interaction during the page loading process. TBT is calculated between First Contentful Paint (FCP) and Time To Interactive (TTI) and measured in milliseconds.
Although it may be less recognizable than Core Web Vitals, TBT is still an important metric that correlates to them and, consequently, can indirectly affect your rankings on Google.
Get ready to take notes — here’s everything you need to learn about TBT to improve your website’s responsiveness.
What is Total Blocking Time?
Total Blocking Time (TBT) is a lab metric that calculates the amount of time when the main thread was blocked between First Contentful Paint (FCP) and Time To Interactive (TTI), lowering a page’s responsiveness.
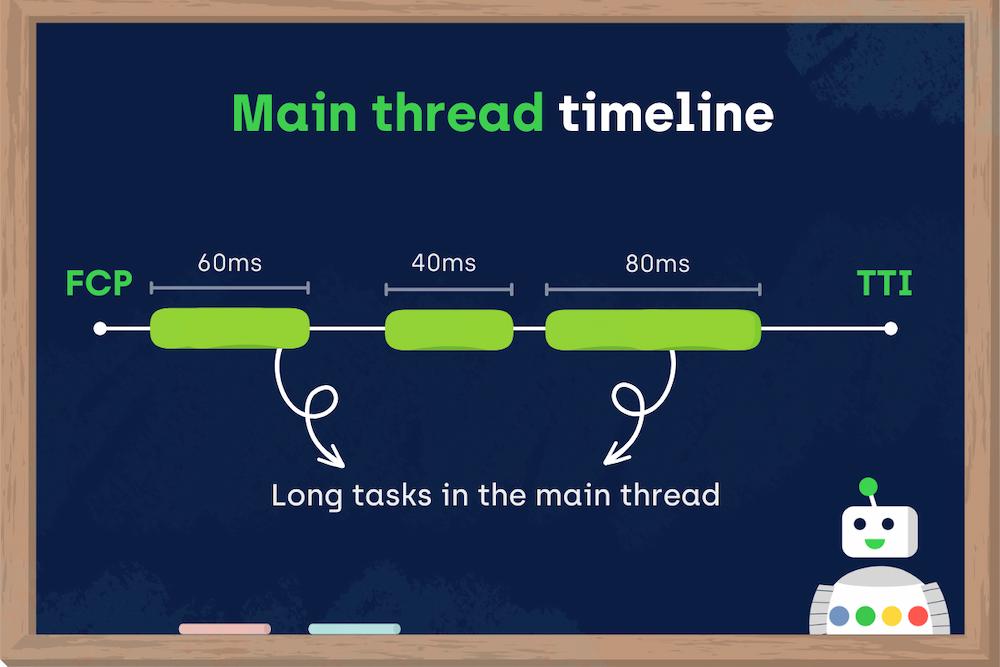
During a page load, beginning from the moment when the page starts loading, the main thread is responsible for dealing with different tasks like parsing HTML or processing JavaScript files.
However, some tasks take long enough for users to experience a noticeable delay. That’s why any task above 50ms is considered ‘long.’ This might seem like an arbitrary threshold, but it’s based on the RAIL performance model.
When a long task is being processed, the browser simply can’t pause it and respond to a user action, like clicking, that occurred while the long task was ongoing.
On the contrary, the browser must wait for the currently ongoing task to end so it can respond to user interaction.
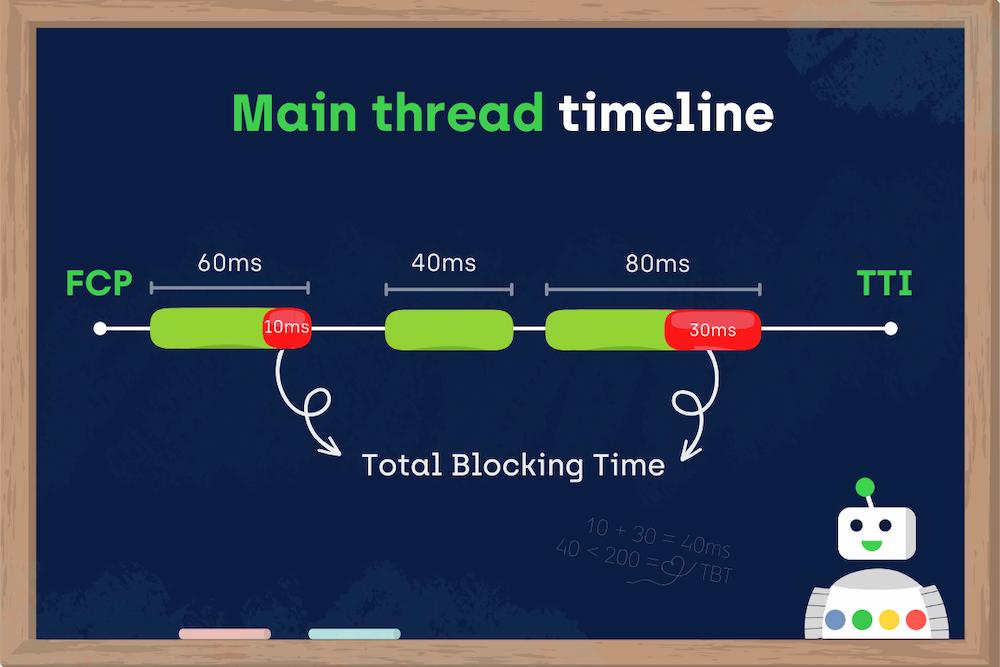
A part of that task that exceeds the 50ms threshold is considered the blocking time.
If the task in the main thread runs for, e.g., 60ms, the blocking time for the long task would equal 10ms.
TBT is the sum of the main thread’s blocking time for all long tasks.
For the sake of an example, let’s do some math. If you have two long tasks taking 60ms and 80ms, you need to add up the blocking time for both, which is 10ms and 30ms, respectively. The sum of them is 40ms, constituting your TBT.
What is the difference between TBT and TTI?
Total Blocking Time (TBT) and Time To Interactive (TTI) are both lab metrics that measure load responsiveness.
They closely correlate with each other, and when properly used within the optimization process, they may bring significant results to a page’s responsiveness, interactivity, and usability.
TBT is a great companion metric for TTI because it helps quantify the severity of how non-interactive a page is prior it to becoming reliably interactive.
Although they share similar goals, TBT and TTI differ in tracking various aspects of a website’s responsiveness.
TBT calculates how long the main thread was blocked from responding to user interactions, and TTI measures how long it takes for a page to become fully interactive.
To be more precise, TTI measures the time since First Contentful Paint to the moment of a page’s full interactivity when event handlers are registered for most elements, and the page responds to user interaction within 50ms. On the other hand, TBT focuses on blocking time for all long tasks between First Contentful Paint and Time To Interactive.
Another vital difference is that TBT is measured in milliseconds while TTI is in seconds.
Read our articles about other web performance metrics:
How does Total Blocking Time relate to Core Web Vitals?
Although TBT is not a Core Web Vital metric, TBT closely correlates with one of them — First Input Delay (FID.)
TBT and FID both measure how responsive your page is, meaning they focus on how long it takes for necessary resources to be loaded and executed so that your page’s elements can quickly respond to any user interactions.
TBT and FID also differ in that they measure load responsiveness with lab and field data, respectively.
According to Google’s official documentation, although FID is a field metric, improving it relates to the recommendations for optimizing TBT that can be measured in the lab.
To help predict FID in the lab, we recommend Total Blocking Time (TBT). They measure different things, but improvements in TBT usually correspond to improvements in FID.
In other words, if you optimize your TBT, you’ll also improve your FID score.
It’s also worth noting that since Core Web Vitals were introduced as part of the Page Experience update in June 2021, FID became an official ranking factor.
It means that improving TBT works as a proxy metric to optimize your FID score and indirectly affect your rankings.
Want to improve the First Input Delay score? Read our article on optimizing First Input Delay (FID) and learn why it’s important for your website’s SEO and user experience.
TBT doesn’t only relate to FID in theory. Here’s an example of how TBT was optimized for outstanding FID results.
How MercadoLibre used Total Blocking Time to improve First Input Delay
MercadoLibre is a leading e-commerce platform in Latin America. Using Total Blocking Time as a proxy metric, the team at MercadoLibre managed to improve their website’s First Input Delay and overall interactivity.
Since First Input Delay cannot be simulated with a lab test, they used TBT to find long tasks blocking the main thread.
Once they determined which tasks needed shortening, they used techniques such as tree shaking (getting rid of unused yet imported code), deferred hydration, and code splitting (splitting code into smaller files) to reduce the size of the code bundles used on the site.
The result was a 90% reduction in Max Potential FID in Lighthouse and a 9% improvement in FID in Chrome User Experience Report.
What is a good TBT score?
As TBT reflects the time it takes for a page to become responsive, the lower your score is, the better, because your users will be able to interact with your content immediately.
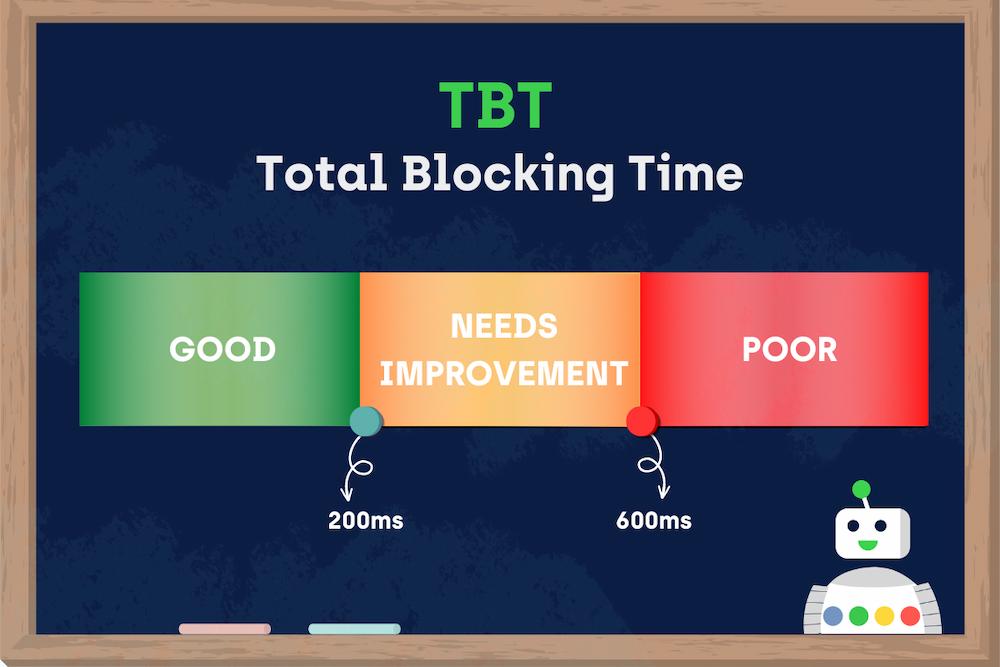
To be more precise, you should aim for a TBT score of less than 200ms.
Here’s what the exact thresholds for TBT look like and how you should analyze them in 2023:
| TBT score | How to interpret your score |
| 0-200ms | Good (Green) |
| 200-600ms | Needs improvement (Orange) |
| More than 600ms | Poor (Red) |
An important thing to note is that along with the Google Lighthouse 8.0 update in June 2021, the Total Blocking Time (TBT) scoring became stricter.
For example, for the Lighthouse 6.0 version, a score of 290ms was still considered good. However, since Lighthouse 8.0, good TBT ends above 200ms.
However, you can expect this metric to be refined as Google regularly researches its metrics and analyzes their impact on web performance. Also, Google engineers believe there’s still room for improvement in the TBT score after the 8.0 version update:
But we think these as our control points would be too jarring and aggressive for now. Still, there’s room to improve, so we’re doing a small shift of TBT being scored more strictly.
If you weren’t aware of these Lighthouse updates, Google introduced a Lighthouse Scoring Calculator where you can check the differences between the current version and previous ones and see how the TBT scores changed over time.
How to measure your TBT?
Total Blocking Time (TBT) should be analyzed based on the lab data.
Although, in theory, measuring TBT in the field is possible, you shouldn’t do that.
Why? Because in the case of TBT tested in the field, there may be too many confounding factors to consider. Also, there are better metrics to measure your website’s responsiveness and interactiveness in the field.
While it is possible to measure TBT in the field, it’s not recommended as user interaction can affect your page’s TBT in ways that lead to lots of variance in your reports. To understand a page’s interactivity in the field, you should measure First Input Delay (FID) and Interaction to Next Paint (INP).
Focusing on that perspective, here are the lab tools to check and analyze your TBT score:
Chrome DevTools
If you’re using Google Chrome as your go-to browser, you can use Chrome DevTools to measure your TBT score and easily identify all long tasks that affect it.
Here’s a step-by-step guide on how to measure TBT in Chrome DevTools:
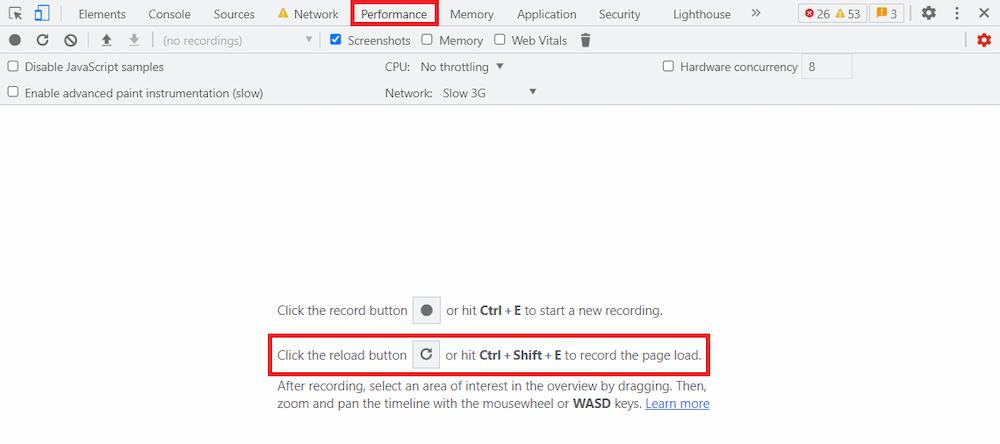
- Open Chrome DevTools by right-clicking ‘Inspect’ on a page you want to analyze, or choosing Ctrl+Shift+I on Windows, and Command+Option+I on Mac.
- Head to the ‘Performance’ section and click the ‘Reload’ button, waiting for the tool to analyze your page.
- Take a closer look at the ‘Main’ section of the generated report. To identify the long tasks that contribute to your TBT, look for grey tasks flagged red.
- Hover over these tasks to see how long it took for a specific task to block the main thread. The sum of all of them calculates your TBT.
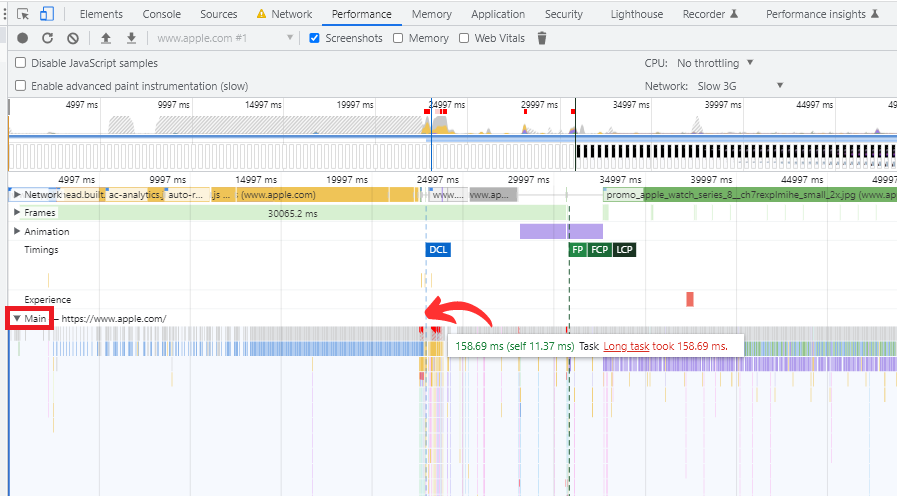
- For more details on each task, you can head to the ‘Bottom-up’ section below.
Lighthouse
Another way to measure your TBT is to run a Lighthouse performance audit.
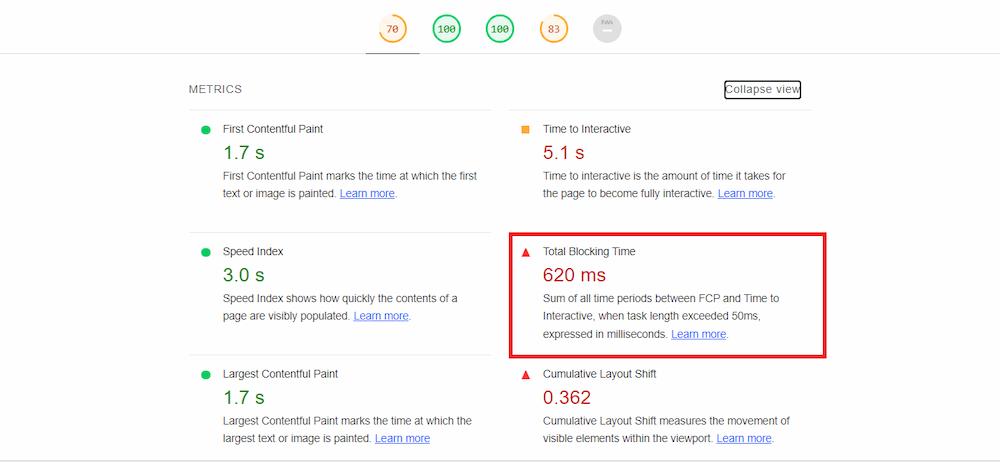
To do this, enter Chrome DevTools and head to the ‘Lighthouse’ tab. Then, click the ‘Analyze page load’ button and wait for Lighthouse to gather data and compute your score.
Having generated the report, you’ll find your exact score in the ‘Metrics’ section in the corresponding color to a threshold you fit into.
WebPageTest
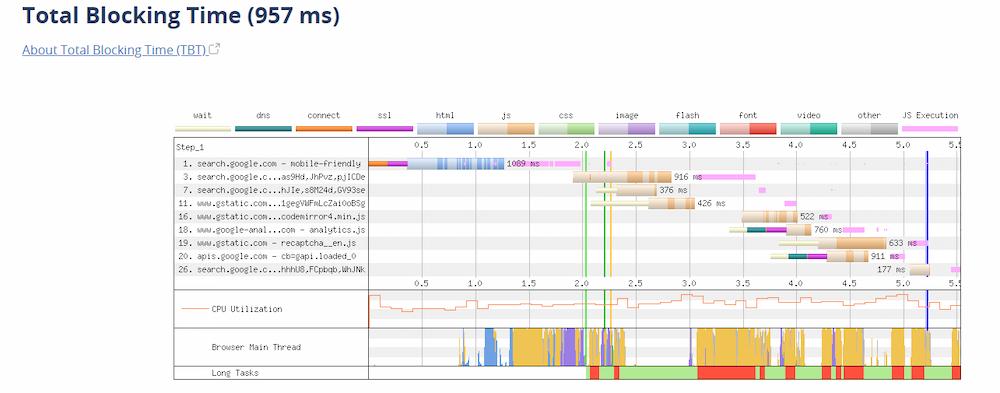
WebPageTest combines Chrome DevTools and Lighthouse features by serving you the exact TBT score and visualizing the long tasks in the main thread.
To analyze TBT with WebPageTest, head to the tool and choose the ‘Core Web Vitals’ tab on the homepage. Then, insert the URL of the page you want to analyze.
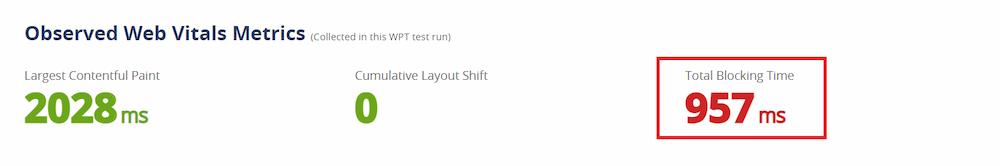
WebPageTest gives you your TBT score at the top of the page in the ‘Observed Web Vitals Metrics’ along with two Core Web Vitals metrics that can also be measured in the lab ‒ Largest Contentful Paint (LCP) and Cumulative Layout Shift (CLS.)
For a more detailed analysis of the long tasks, you may dive into the ‘Total Blocking Time’ section at the bottom of the results page to see the long tasks blocking your main thread organized by the type of script.
How to fix poor Total Blocking Time?
Having analyzed your TBT score, you can now use that data and tools to optimize it.
As a starting point, Lighthouse can provide specific recommendations to improve your TBT performance.
All you need to do is to scroll down the metrics and filter out the results in the ‘Diagnostics’ section so the audit shows you the guidance relevant to TBT.
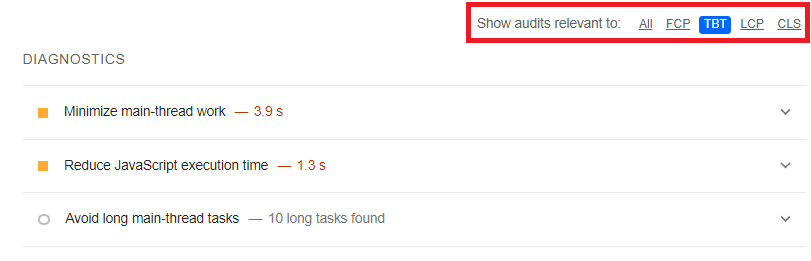
The specific recommendations may differ depending on your page’s problems, but they all aim to reduce your total blocking time for your page’s better responsiveness.
However, in general, there are four main ways to improve your TBT score:
| Recommendations | Plan of action |
| Reduce the impact of third-party code | While social media and analytics scripts are indispensable, they all may negatively influence your page loading performance. To troubleshoot it, identify slow third-party JavaScript and optimize how you serve it by, e.g., using the async or defer attributes, third-party CDN hosting, or service workers for caching. |
| Reduce JavaScript execution time | In general, to avoid unnecessary JavaScript loading and execution, you should deliver smaller JavaScript payloads to process. To do this, minify, compress, remove your code, or split it into smaller files. |
| Minimize main thread work | When minimizing main thread work, you should reduce the time it spends on parsing, compiling, and executing CSS and JavaScript files. As part of the optimization process, consider, e.g., using web workers, minifying and deferring non-critical CSS, using code splitting, or removing the unused JavaScript code. |
| Reduce request resource counts and transfer sizes | Improve your page load time by improving your resource delivery (choose CDNs) and optimizing your CSS and JavaScript (focus on shipping only the necessary code.) Here’s when you may take advantage of JavaScript SEO services. |
Although the guidance above can be used for all pages struggling with high TBT, I understand that, in practice, many variables could make the TBT optimization more complicated than expected.
If it’s the case for you, don’t worry ‒ I know how we can help you.
At Onely, we provide our clients with a detailed plan of action based on the data-driven analysis of their websites’ specific needs. It also means that we closely cooperate with their development teams giving them precise recommendations and overseeing the whole process.
NEXT STEPS Here’s what you can do now: Still unsure of dropping us a line? Check how our Web Performance and Core Web Vitals services can help you improve your responsiveness, interactivity, and visual stability.
Key takeaways
Here are the six most important lessons you should remember from my article:
- Total Blocking Time (TBT) calculates the time between FCP and TTI when the main thread was blocked from responding to user input.
- Strive to have a TBT of less than 200ms. TBT is a lab metric, so you can measure your score using Chrome DevTools, Lighthouse, and WebPageTest.
- TBT may work as a proxy to improve your FID score and your pages’ responsiveness. And since FID is part of the Core Web Vitals ranking signals, better TBT also may contribute to your website’s rankings on Google and not just your users’ experience.
- To improve your TBT score, you should focus on reducing the impact of third-party code and JavaScript execution time, minimizing main thread work, and keeping request counts low and transfer sizes small.
- While TBT and TTI may be confused with each other, they are two different metrics that closely correlate.
- Remember that high TBT indicates that your page is non-responsive, so your users may experience significant delays in the page load. Contact us for an in-depth analysis of your website performance issues.

Hi! I’m Bartosz, founder and Head of Innovation @ Onely. Thank you for trusting us with your valuable time and I hope that you found the answers to your questions in this blogpost.
In case you are still wondering how to exactly move forward with your organic growth – check out our services page and schedule a free discovery call where we will do all the heavylifting for you.
Hope to talk to you soon!