
For several years, INP was an experimental and later a pending metric.
Some found it familiar, others overlooked it, and a few actively addressed it in anticipation of changes in Core Web Vitals metrics.
Since March 12th, INP has become a stable Core Web Vital, which is now one of the ranking factors.
If you’re reading this article, you likely belong to one of the first two groups I mentioned earlier.
Still unsure about how to measure INP?
Don’t worry — I’ve got you covered!
By the way, if you’re still unsure about what INP is and how it’s calculated, I recommend visiting our post that explains what Interaction to Next Paint is about.
How to measure the INP metric
There are two main methods to gather information about INP:
- Lab Data: Data collected in a preset environment using certain devices and internet speeds (synthetic monitoring). It gives a good guess of how a website performs but doesn’t fully capture what real users experience. It’s handy for spotting potential problems when you don’t have data from real users.
- Field Data (or Real User Monitoring – RUM): This method collects real browsing experiences from users, showing problems that lab tests might not catch. Since it depends on the devices and internet speeds of users, it offers a peek into how the website performs in the real world.
You can read more about lab and field data here.
Important to note: Data from the lab and field can be differentiated. That is because website visitors might use completely different internet connections or devices than you or your dev team.
For those measuring lab data, I recommend the following:
- Chrome Dev Tools – These tools are built into the Chrome browser by default. You can access them by pressing “Cmd+Left Shift+I” on the keyboard (Mac), “Ctrl+Left Shift+I” (Windows), or by right-clicking on a page and then clicking on “Inspect.”
- “Web Vitals” Chrome Extension – Available at the Chrome Web Store.
For measuring in the field, you might consider using:
- Google Search Console or CrUX Dashboard – useful for auditing your website. They provide a broader picture of whether your website needs improvements.
- Web-Vitals JavaScript Library or Core Web Vitals Template – a free method for measuring user experience. It gives you insights into which pages and elements are suffering poor interactions (note that this requires some technical knowledge to implement).
- RumVision, DebugBear, or Coralogix – a few of the many available paid RUM (Real User Monitoring) providers on the market that make measuring INP and other performance metrics much easier.
Now, let’s move to the article’s core, and let me walk you through the tools and help you choose the best for you!
Tools that can measure/audit the INP
Measuring the speed of interaction, whether in the lab or the field, can be achieved through various methods. Some are easy to use and provide a general overview, while others demand technical knowledge that assists in identifying poor interactions.
Additionally, there are paid solutions that are straightforward to install and intuitive to use.
Below are tools for measuring INP in the lab and in the field. Please note that this is not an exhaustive list.
Lab measurements
[Tool 1] Chrome dev tools
Chrome browser users can test or evaluate Interaction to Next Paint in a controlled environment using developer tools. By selecting ‘timespan’ and ‘performance’ in the Lighthouse tab, users can generate a report detailing the INP metrics.
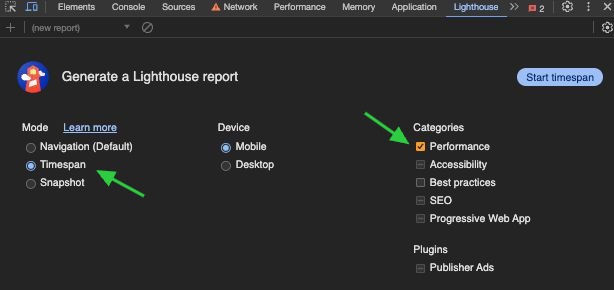
Just record your interactions, and voila!
[Tool 2] Web Vitals extension
The Web Vitals Chrome extension displays, among other things, the INP score after interacting with a page.
It’s important to note that this tool only records the interaction once. If you wish to measure a different one, you must reload the page, as I haven’t found a better workaround for this yet.
Field measurements
[Tool 1] – Google Search Console (Auditing)
The widely-used Google Search Console (GSC), accessible to every website owner, can help identify if your website has slow interaction issues.
Simply go to the GSC dashboard, click on the Core Web Vitals tab, and select either the mobile or desktop panel, depending on what you want to check.
Note: Core Web Vitals metrics are calculated separately for different devices.
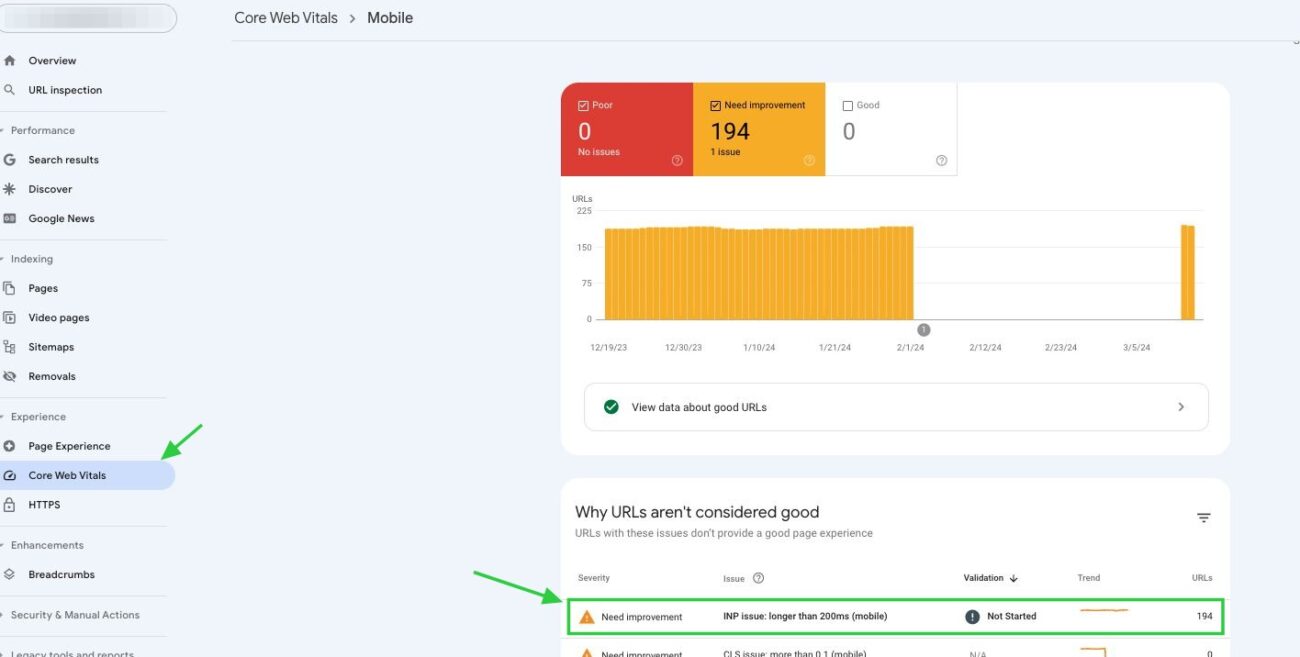
When you’re there, find and click on the row in the table where the INP score is labeled as ‘needs improvement‘ or ‘poor’. This will show you which URLs are having issues with slow INP.
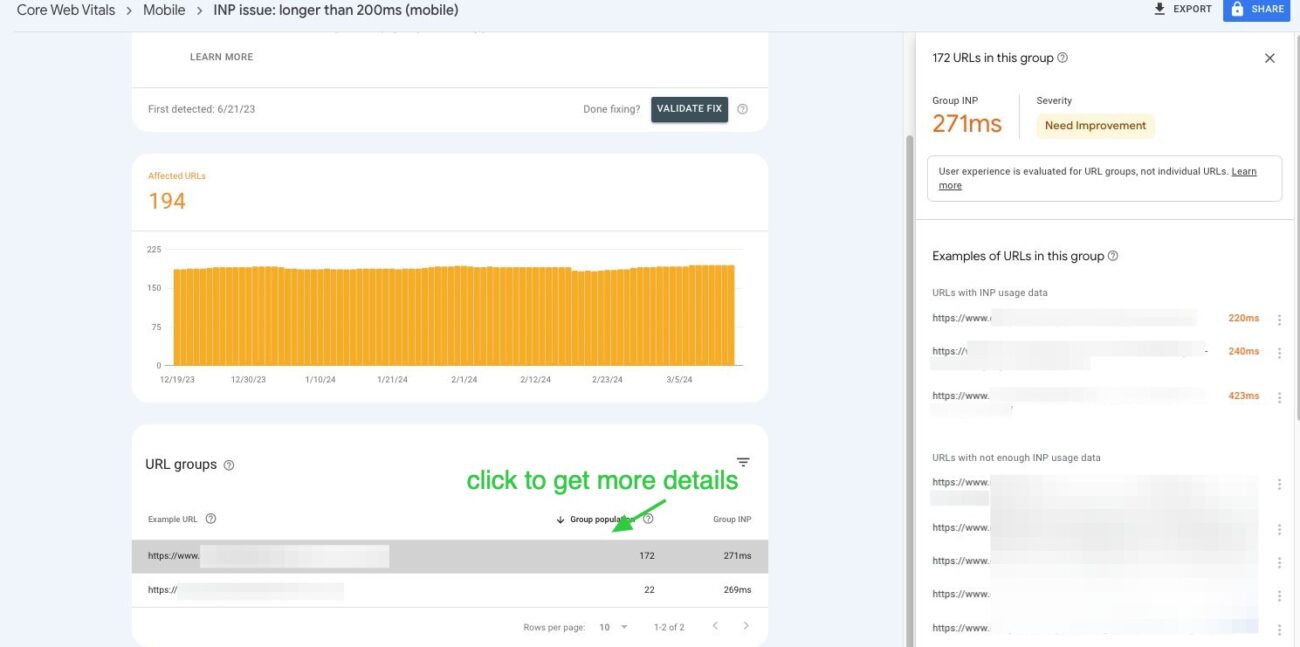
However, keep in mind GSC has its limitations. It doesn’t report all INP times for each URL in a group, nor does it specify which element caused the poor score. Despite this, it’s a useful starting point for identifying potential INP issues on your site.
[Tool 2] – CrUX template report (Auditing)
Rick Viscomi released the CrUX Dashboard Launcher some time ago. This tool greatly simplifies the process of verifying CrUX.
You can create a dashboard in just one step, which includes Core Web Vitals and other metrics for a specific domain. Among these metrics, the report provides insights into the domain’s INP scores for different devices over a prior 10-month period.
Just use the link from the first paragraph, paste the domain into the box, and push enter.
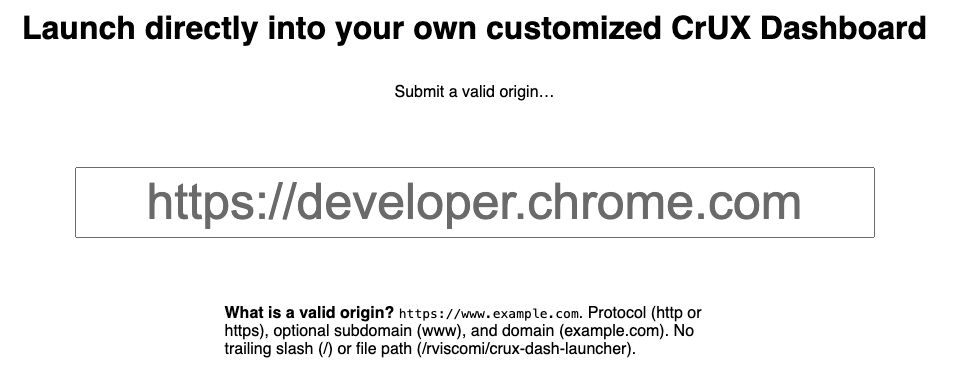
Keep in mind that not all domains appear in the dataset.
This might be because the domain isn’t publicly discoverable, or it doesn’t attract enough visitors.
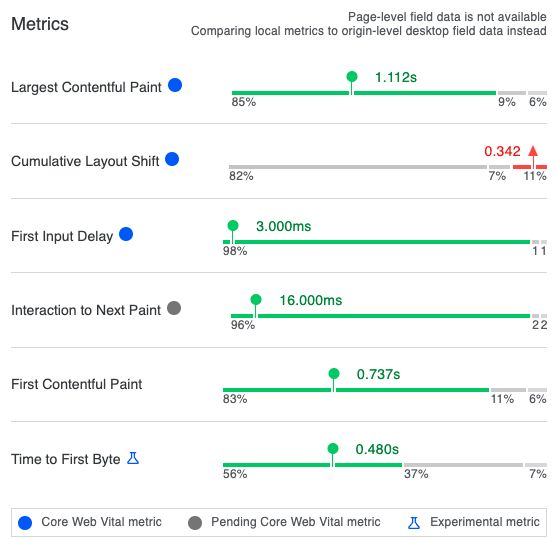
If your website is included in the dataset, you should see a dashboard similar to the one described below.
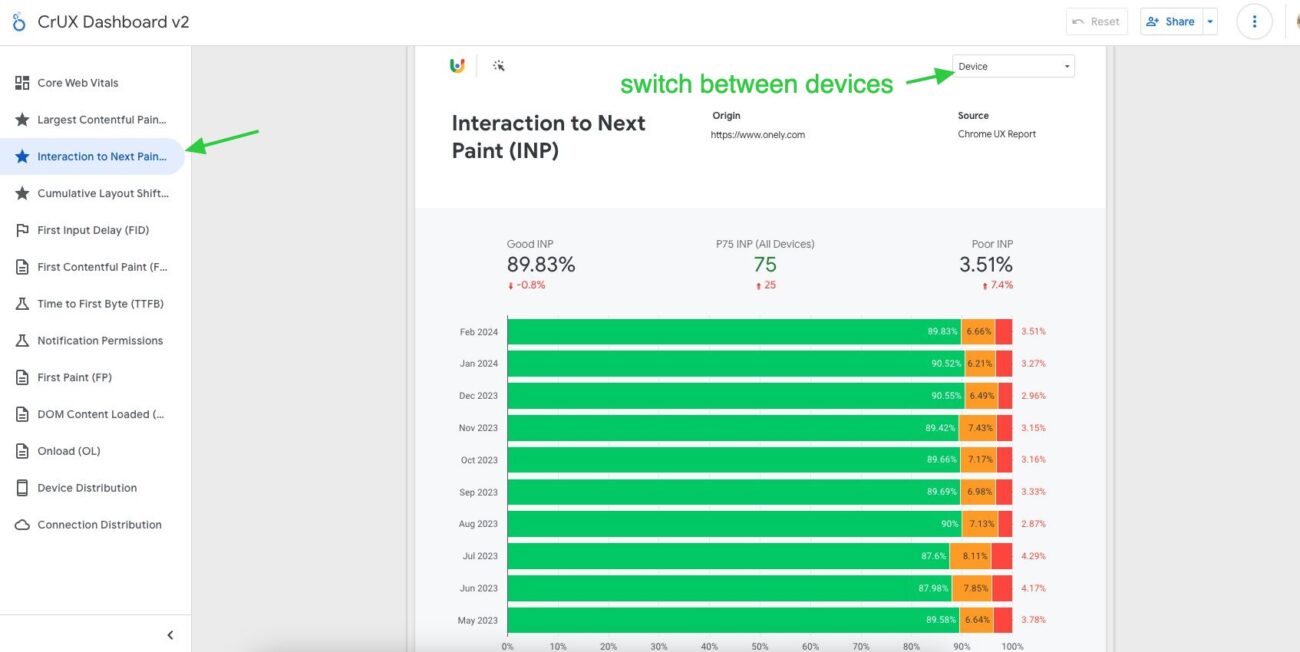
The CrUX dashboard is an excellent tool for sharing website performance scores with colleagues or clients and for comparing your domain against competitors. Much like the GSC, it offers a solid foundation for assessing whether a website needs improvements.
[Tool 3] – web-vitals JavaScript library
Googlers have released a JS library designed to collect data about the INP and send it to a Real User Monitoring (RUM) provider. I strongly suggest exploring it — you can do it right here.
However, this solution has a catch:
You need to have coding skills or access to a developer who can assist in its implementation.
If you want to use GA4 for that, implement the code below on your website (source: web.dev) and find slow interactions in the field.
// Be sure to import from the attribution build:
import {onINP} from 'web-vitals/attribution';

function sendToGoogleAnalytics ({name, value, id, attribution}) {
  // Destructure the attribution object:
  const {eventEntry, eventTarget, eventType, loadState} = attribution;

  // Get timings from the event timing entry:
  const {startTime, processingStart, processingEnd, duration, interactionId} = eventEntry;

  const eventParams = {
    // The page's INP value:
    metric_inp_value: value,
    // A unique ID for the page session, which is useful
    // for computing totals when you group by the ID.
    metric_id: id,
    // The event target (a CSS selector string pointing
    // to the element responsible for the interaction):
    metric_inp_event_target: eventTarget,
    // The type of event that triggered the interaction:
    metric_inp_event_type: eventType,
    // Whether the page was loaded when the interaction
    // took place. Useful for identifying startup versus
    // post-load interactions:
    metric_inp_load_state: loadState,
    // The time (in milliseconds) after page load when
    // the interaction took place:
    metric_inp_start_time: startTime,
    // When processing of the event callbacks in the
    // interaction started to run:
    metric_inp_processing_start: processingStart,
    // When processing of the event callbacks in the
    // interaction finished:
    metric_inp_processing_end: processingEnd,
    // The total duration of the interaction. Note: this
    // value is rounded to 8 milliseconds of granularity:
    metric_inp_duration: duration,
    // The interaction ID assigned to the interaction by
    // the Event Timing API. This could be useful in cases
    // where you might want to aggregate related events:
    metric_inp_interaction_id: interactionId
  };

  // Send to Google Analytics
  gtag('event', name, eventParams);
}

// Pass the reporting function to the web-vitals INP reporter:
onINP(sendToGoogleAnalytics);
Implementing this code on the website will also require creating custom metrics in GA4 once the parameters are delivered to the property.
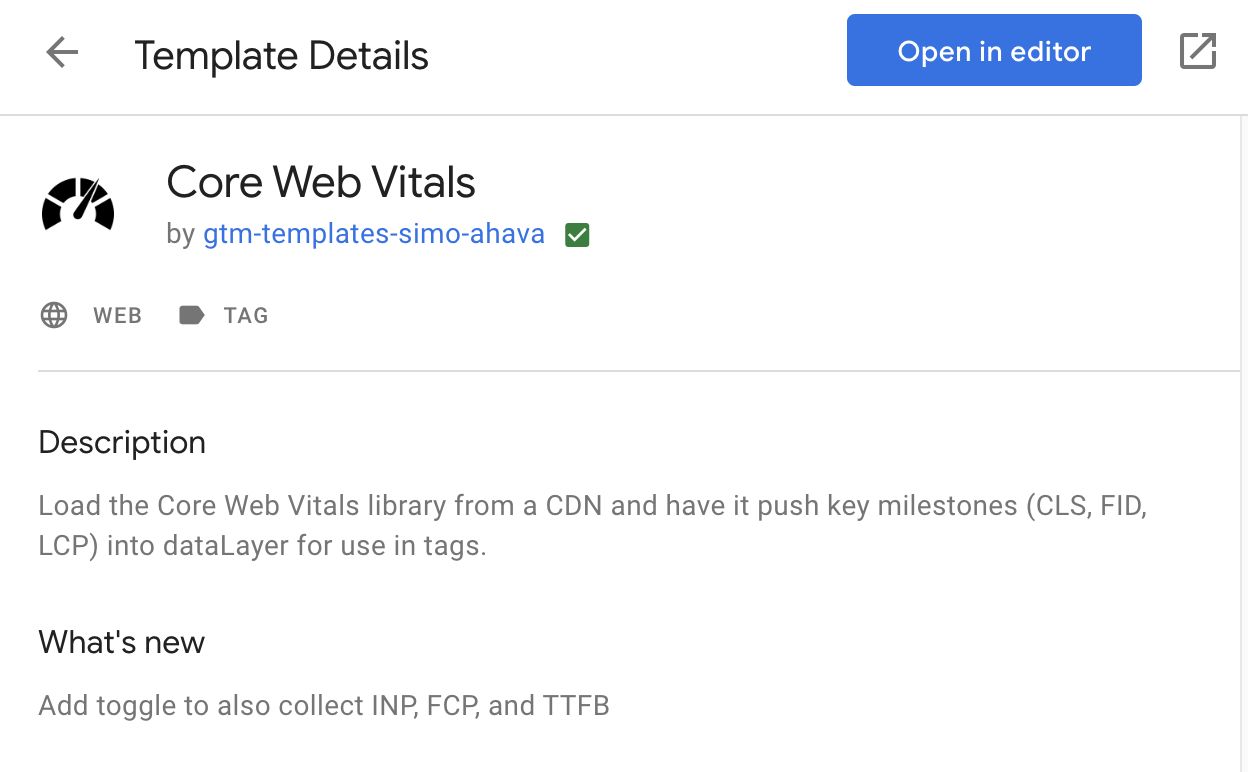
[Tool 4] – Core Web Vitals Template for GTM
A few years ago, Simo Ahava created a guide and a template for GTM that collects CWV metrics from visitors’ experiences and sends them to Google Analytics. This is a great way to implement CWV measuring on your page without having developer knowledge.
[Tool 5] – Paid tools – RUM providers
There are plenty of paid tools that can measure the INP metric based on real user experience.
A complete list of RUM providers would be long, so just to give you an idea, here are a few examples of RUM providers that can measure INP:
The advantages of using paid tools, among others:
- ease of installation,
- data presentation,
- support from the RUM provider.
However, there is one big disadvantage for some of you—these tools are not free. However, some tools let you test them out for free. For instance, Debugbear won’t ask for your credit card details just to try it out.
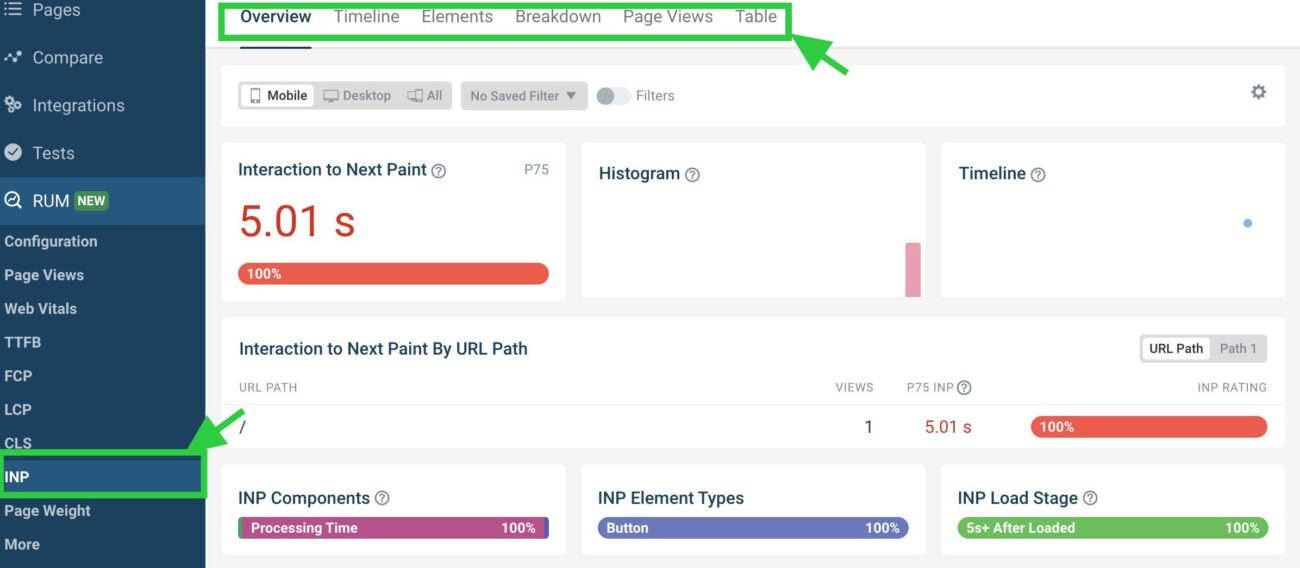
Curious about what you get with these paid services, I gave DebugBear a whirl on my site to see what setting it up and navigating the interface was like.
After starting a new project, I had to add a small bit of code to the website.
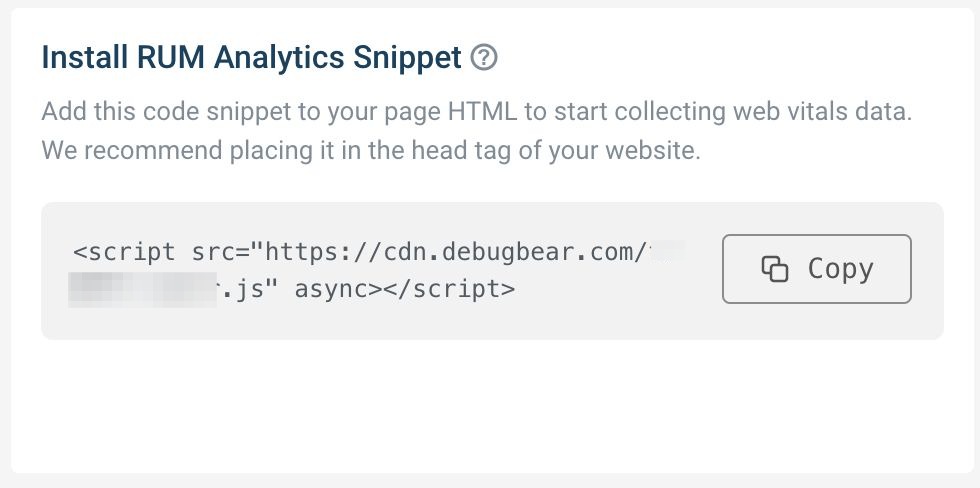
After I got that bit of code in place, I could check out the INP scores right from the INP tab with all the necessary details needed to find out which interactions are slow.
From my point of view, while having paid tools for measurement can be a nice bonus, it’s definitely not essential. Sticking with free options works pretty well too, since you’re essentially getting the same kind of data.
Which one to choose? Pros and cons
You might be wondering, “Which method should I use to measure the INP?”
Ideally, both methods should be used, but this might not always be possible. However, if you can measure the INP using both field and lab methods, that would be ideal!
Why is using both methods beneficial?
First, field data lets you identify if and where your visitors are experiencing slow interactions. Second, lab data helps you measure whether your efforts to improve interaction are effective.
Below is a table outlining the key pros and cons of each method for gathering INP data.
| Field Data | Lab Data | |
| Pros |
|
|
| Cons |
|
|
Final thoughts
Measurement of the INP metrics is not the easiest one. As FID before and now INP, interaction is required to capture the value. However, identifying slow interactions becomes much easier once you properly set up the measurement.
My suggestion is to implement one of the solutions I’ve described above right away. This could change even if your website isn’t currently facing issues with poor interactions. The worst-case scenario would be encountering this problem and being left without any data, leaving you to guess which interactions lower your website’s rating.
The sooner you start gathering data from visitors, the quicker you’ll be able to address and improve any poor interactions.
One last piece of advice:
Don’t let INP hurdles hold back your website’s success. If you need help, partner with us for top-tier Technical SEO Services, overcome INP challenges and propel your site to new heights of performance.
Read our other articles about INP:

Hi! I’m Bartosz, founder and Head of Innovation @ Onely. Thank you for trusting us with your valuable time and I hope that you found the answers to your questions in this blogpost.
In case you are still wondering how to exactly move forward with your organic growth – check out our services page and schedule a free discovery call where we will do all the heavylifting for you.
Hope to talk to you soon!