
I recently met a developer who was really excited about Google Lighthouse. He told me developers wouldn’t need the help of SEO specialists anymore because Google had released this tool that would do all the work for us.
Well, I guess everyone in the know who has used Google Lighthouse has an idea about how wrong he was. However, I won’t be writing about that. I am going to focus instead on the fact that we, as SEOs, should care about this tool and, most importantly, the metrics it uses. Google’s stance on website performance is quite explicit, but some of us still tend to ignore it.
You can also benefit from this article if you are completely new to SEO – it will explain what Lighthouse is and how it can support your efforts to reach your potential client/audience.
What is Google Lighthouse?
Google Lighthouse is a part of Chrome DevTools. It’s the first complex tool designed to assess website optimization provided by Google directly. We previously had PageSpeed Insights, Mobile-Friendly Test, Structured Data Testing Tool, etc., but these tools focused on one area solely. Google Lighthouse goes beyond that, and while it’s mainly focused on performance, it examines a given page from different angles. It takes a considerable amount of factors into account to perform multiple audits and provide a clear assessment.
The first Lighthouse version was released in June 2016. It didn’t make much noise in the SEO world because the user interface, as well as the features, was very limited. It has had many releases since then, with two major ones – the 1.5.0 and 2.5.0 versions. At the time of writing this article, the 2.8.0 version is the latest release.
Google Lighthouse isn’t a tool targeted strictly at developers. If it was, it would probably be accessible from the command line only. Rather, it has a really nice user interface that you can use from the browser level without any coding knowledge.
Speaking of which, you can access Google Lighthouse from the Audits tab in Chrome DevTools, from the command line, or as a Node module. You can also use it as a Chrome extension or run it on WebPageTest.org.
It is a tool designed to make everyone in the organization care about its website’s performance. SEOs should be first in line to use it and make other people involved in the project do it as well.
A game changer in terms of measuring website speed
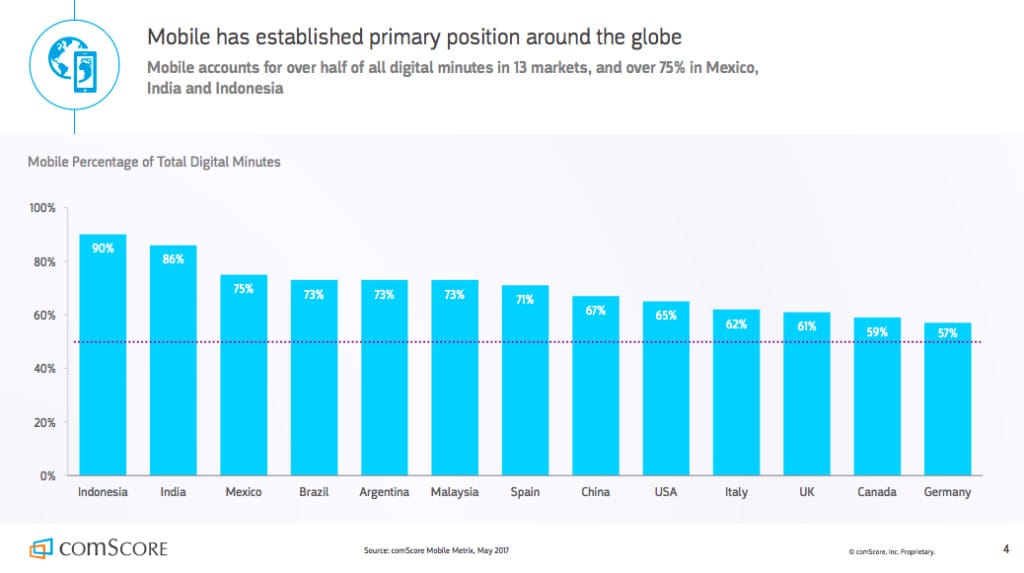
I hope everyone in the industry is aware of the importance of website speed at this point. The modern user spends way more time on their mobile than desktop. They are impatient and want to obtain information immediately. The fact of whether or not you are able to provide them the content in the blink of an eye will decide if you stay in business or fall behind.
Now let’s move to the most interesting part: How should we measure website speed?
What metrics should we look at? What value is good enough? Is the Time To First Byte (TTFB) or window.onload event most important?
The “standard” approach is to measure how fast the subsequent parts of the loading process are done. Metrics that can be used for that include TTFB, DOMContentLoaded event, Onload event, Fully Loaded event, etc.
Not all of these metrics are self-explanatory, so let me quote some definitions:
Are you safe looking at only these metrics? They appear to be quite sensible, but… the results differ among different tools and you never know what the final experience will be. Google says: Let’s skip all these static metrics and switch to the user-centric ones:
What are user-centric website speed metrics?
User-centric metrics, as the name implies, revolve around the user experience. They rely heavily on the conditions in which people are using your website or web app – it may be a slow internet connection or an outdated device. So you should not only care about your website loading with the blazing-fast speed in ideal conditions. It should be capable of performing fast even if the user is driving through the desert in a Faraday cage.
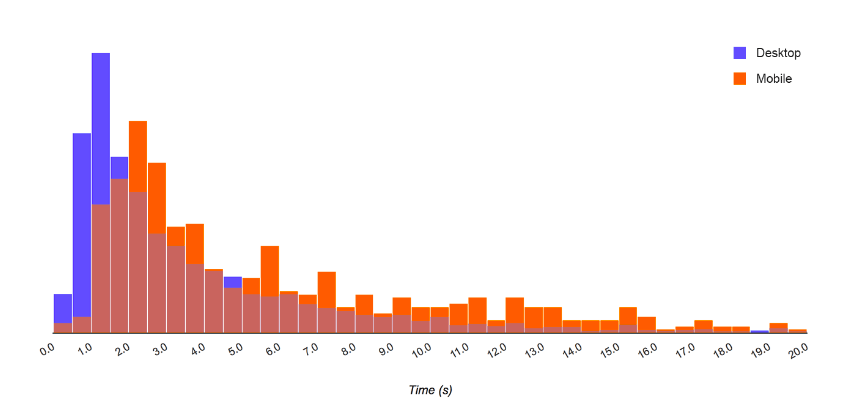
In other words: you should care about the average user when optimizing your website performance, not just the one with an iPhone X and a 30 Mbps LTE connection. Google Chrome Usage Report shows that the average user uses a MotoG4 on a 3G connection. Also, apart from the average user, you should be aware that the timings for the user experience differ in different conditions. Page speed is not a number – it is a collection of numbers. So, a histogram is a much better way of presenting this information:
How does the user perceive website speed?
To answer this question we need to first understand something important – website speed can’t be reduced to the time between page loads, especially when JavaScript is so omnipresent. Users take a lot of actions within a website and expect a response. A very specific example of this is a Single Page App, where the subsequent page loads don’t exist at all. If properly configured, users won’t even notice that they are constantly interacting with the same HTML document.
Measuring user perception sounds like a really complicated task and it is. How does Google approach this topic? Let me quote one of their blog posts:
This is where the RAIL (Response, Animation, Idle, Load) model comes in handy. It is a performance model focused on different parts of a website’s or app’s lifecycle.
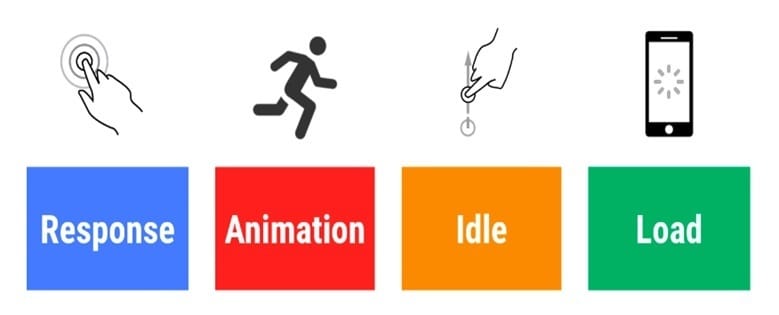
According to this model, performance is not only about the page loading time. RAIL provides specific timeframes in which the website or web app should respond to different actions taken by the user. The whole idea is not to break the connection between the action and reaction during the entire experience. In other words, RAIL aims at not letting users notice the lag throughout the whole website or app lifecycle (from entering the website to leaving it).
It makes sense from a business point of view – users’ perception of website speed will decide if they stay or leave. They don’t care if it obtained great results in the testing software.
I bet you know from experience: frustrating lag when scrolling on mobile, freezing animations, slowly responding buttons, input fields visible but not ready to use…
Ugh, sounds like a nightmare!
The main takeaway from the RAIL model is: Load the page in less than one second, respond to a user action in less than 100ms, make smooth animations by producing a frame in 10ms and defer loading non-critical data to idle time. Going beyond these time frames puts you at risk of providing a frustrating user experience somewhere during the web app lifecycle.
Important! In this model, the “Load” metric is not representing the actual time of full page load or any event that can be measured regardless of the real user experience. It’s the time when the user perceives page load as completed.
How to measure user perception
Simulating all the possible user behavior and the conditions in which they use your website or web app would be complicated and costly. So why not, for example, monitor the actual users?
Real User Monitoring (RUM) is as simple as it sounds. It is focused on passively recording all user interaction with the website and monitoring the actual End-User-Experience. The recording is done with the help of a small chunk of JavaScript embedded on each page. The JavaScript collects the data from users as they explore the page and sends the data for analysis.
The important part is that all users are constantly monitored. This is why the gathered data shows a full picture of a website’s (or app’s) availability, functionality, and responsiveness.
There are many tools you can use for RUM. Some exemplary ones are Pingdom Visitor Insights, TraceView, or mPulse. RUM may be used for testing in the pre- or post-deployment phase in order to check how your new features influence user behavior. As a developer, you can use APIs like PerformanceObserver, PerformanceEntry, and DOMHighResTimeStamp to check user-centric metrics on real devices.
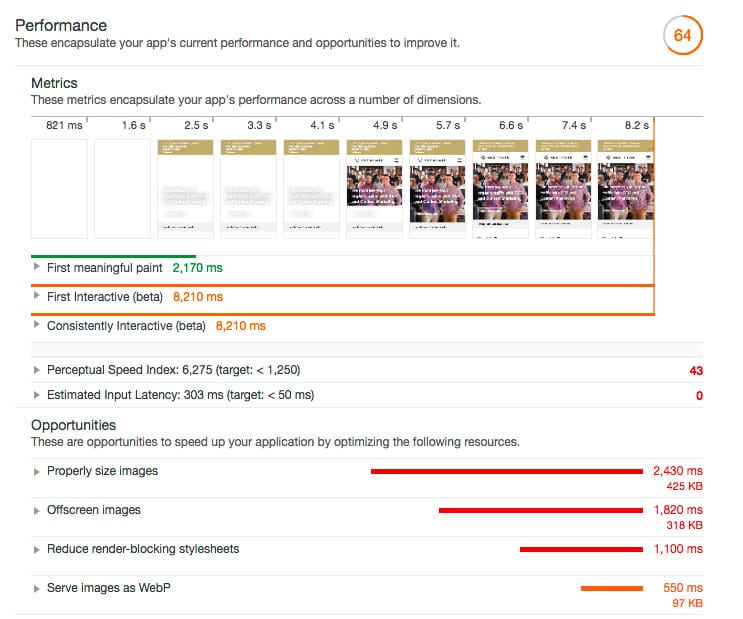
User-centric metrics in Google Lighthouse
With all this background, let’s go back to Google Lighthouse. The challenge the creators of this tool were facing was creating metrics and benchmarks for the user perception of website performance. What is the advantage of having gigabytes worth of data if you don’t know what are you aiming for?
They determined six stages in the page loading time that correspond to the real user perception of website speed.
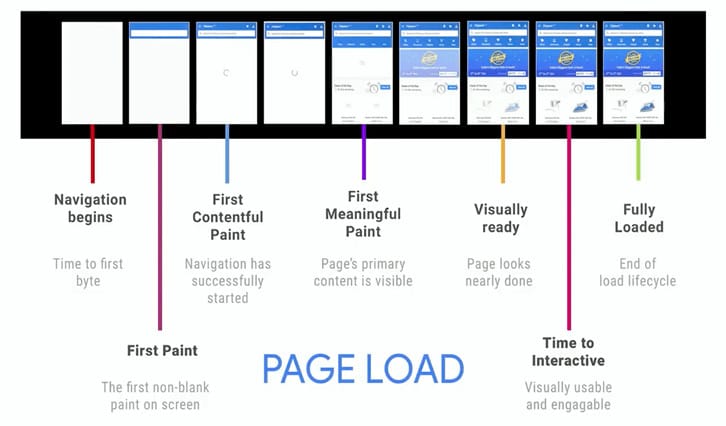
- First Paint – the first pixel changes on the screen.
- First Contentful Paint – some content appears in the DOM and is painted on the screen.
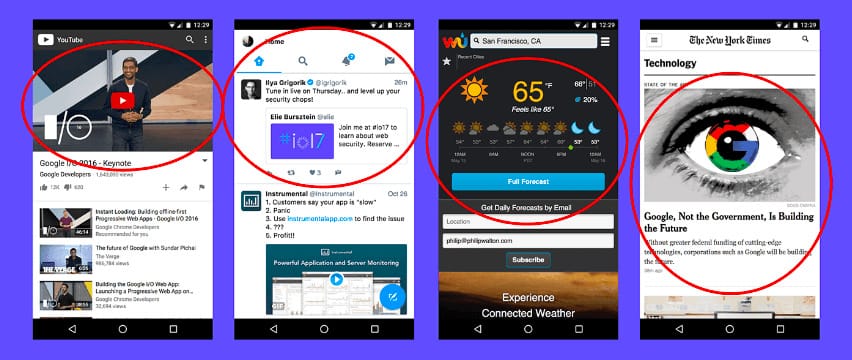
- First Meaningful Paint – primary elements visible on the page – “hero elements.”
Below is an example of hero elements on different web pages:
- Visually Ready – page is not missing any visual components in the users’ perception
- Time to Interactive – page is able to respond to the users’ input
- Fully Loaded – page is fully functional
Did you notice the huge difference yet? In this approach, we don’t care when all the JS and CSS files are loaded. We also don’t care about the complete DOM and when the page becomes idle. What we do care about is: When users see the first visual change on the page, when the first content becomes visible, when the core content becomes visible and when a page becomes fully interactive.
If you are curious how your website’s loading times compare with the rest of the web, you can check it here.
Again, the whole idea is not to lose the users’ focus and not to break the connection between action and reaction. A page that doesn’t distract the user with unexpected behavior will win the race.
How to apply it in real SEO life
OK, but these are mainly UX metrics. What does it mean for SEO?
We can assume that Google is consistent in its methodology and uses similar metrics for ranking pages in the search engine. The main goal of the search engine is to provide the best results for users and it ranks high pages that users are satisfied with. So some of the “standard” SEO rules are not applicable anymore. Learn your lesson from the user-centric approach in order to put a website at a competitive advantage. It will help you avoid pointless disputes with designers and UX specialists as well.
Some of the SEO conclusions based on the new performance metrics are:
- Don’t treat the website speed as something static. One test is not enough.
- Optimize for the average user, or the range of users, or the whole distribution of your website’s users. Don’t optimize for lab conditions.
- Test mobile and desktop separately.
- Don’t tell developers to combine all the JS or CSS files into one. First, load as little JS and CSS as is needed to support the core functionalities. Then, add the subsequent functionalities progressively.
- Don’t recommend deferring loading JavaScript in favor of visual content. The user won’t take advantage of a visually ready page if they can’t perform basic actions on it. Try to make content and functionality go hand in hand.
- Don’t tell developers to make all JS external. Small parts of inline JS can perform faster than external ones.
- If using multiple JS and CSS files, recommend optimizing their order. Help the browser decide (Googlebot is a browser as well) which files should be loaded first.
- Recommend serving images in the size they will be used on the page. They shouldn’t be resized in the CSS.
- Recommend lazy-loading the images that need user interaction to become visible.
- Recommend painting the first pixel as fast as possible. Remove elements blocking the first paint and the first contentful paint as it will also contribute to your Total Blocking Time score.
- Recommend avoiding long tasks (taking more than 50ms). The code should be executed in small chunks, preferably asynchronously – it will leave room for responding to user input.
- Recommend providing feedback to the user for actions that will take more than 500ms.
- Don’t treat the third-party code as something that can’t be optimized. Remove or replace it if it hurts website performance and therefore your business.
Useful tools and constant performance monitoring
Which tools, apart from Google Lighthouse, can help introduce you to this new performance approach in your day-to-day work?
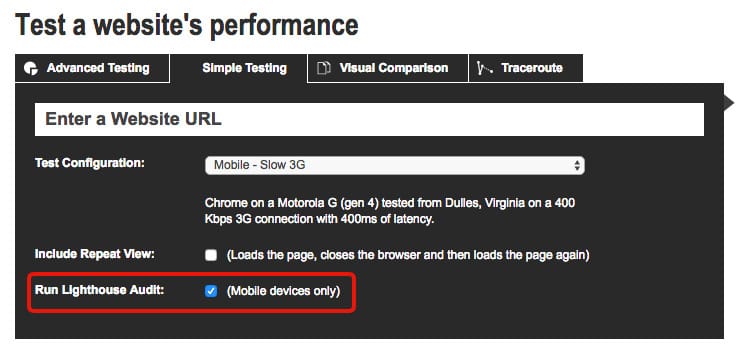
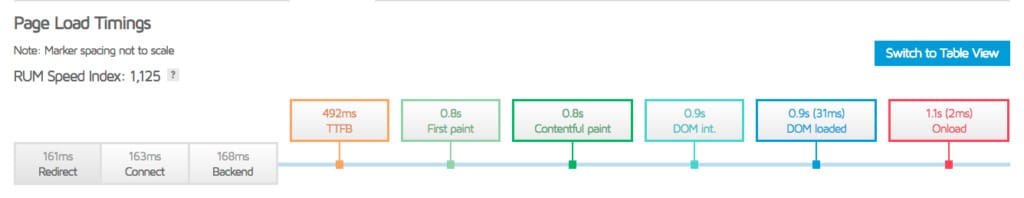
Some of the testing tools that implement user-centric metrics (fully or partially) are GTmetrix and WebPageTest.
GTmetrix shows the First Paint, First Contentful Paint, and DOM interactive metrics:
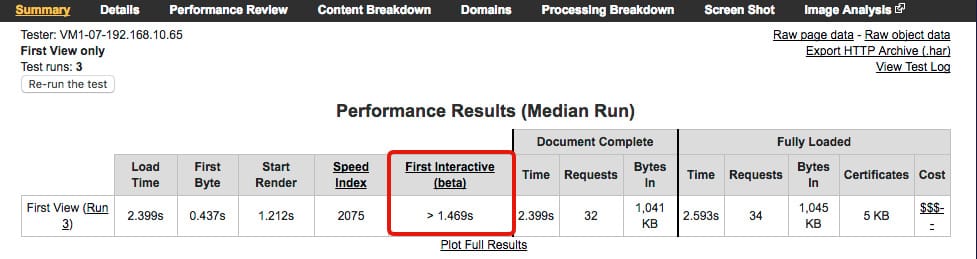
You can see a beta version of the First Interactive metric in the standard WebPageTest report as well:
It looks like it’s not just Google’s whim then. We should adjust our recommendations and put the user first.
What about monitoring? I know you may not fancy triggering audits manually all the time. It would be great to set up constant monitoring and you can use Calibre or SpeedCurve for that.
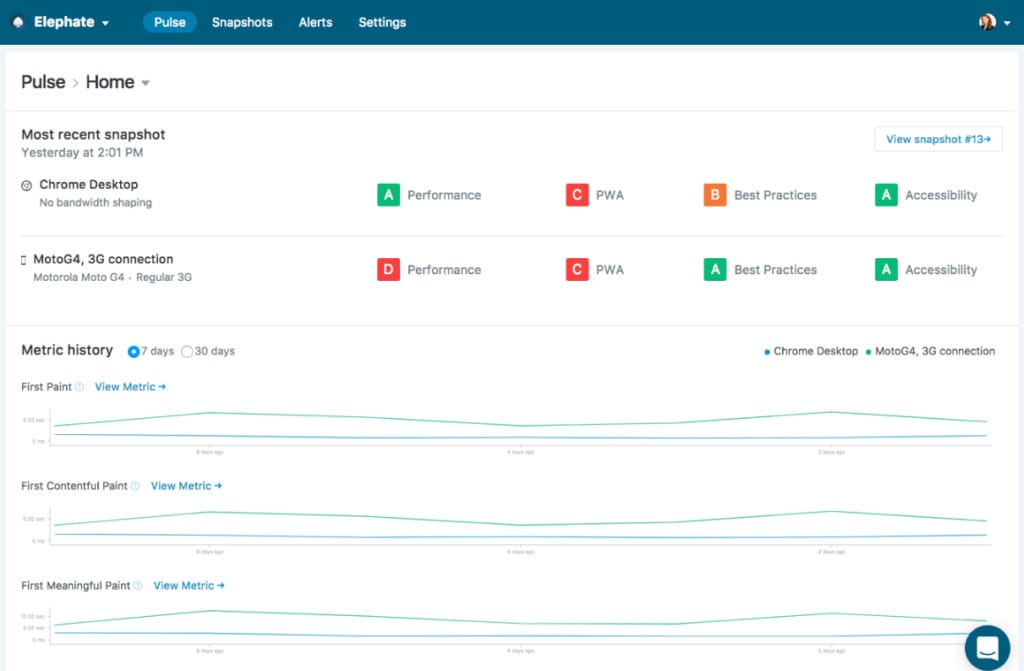
Calibre takes page snapshots and provides detailed results for each of them.
It’s possible to configure your testing profile, for example, by changing the device and adding multiple pages to the analysis.
What if I have a decently optimized website and don’t want to spoil it? How to maintain the good condition of the website?
First, you should talk to the developers (scary!) and convince them to include Google Lighthouse testing as a part of the standard development process. It’s possible to set up desired audit scores and test the page against them. If the planned deployment makes the score go below the threshold, it doesn’t go to production. This way, you should be safe at all times.
Developers can also set custom alerts for the code that is already released. They will notify you if the performance gets worse – it may happen, for example, if the third-party code gets updated to a newer version.
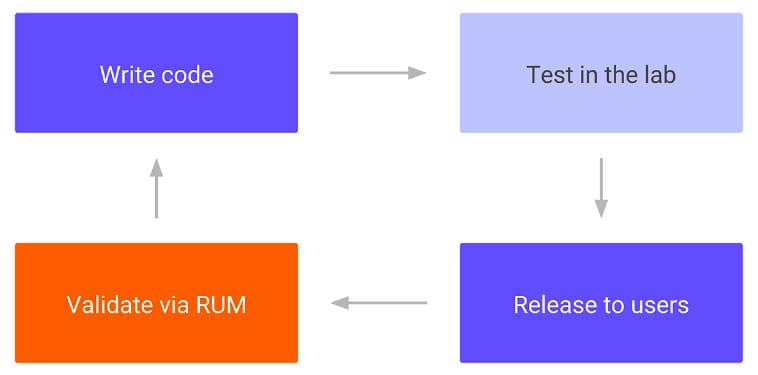
The code lifecycle for meeting user-centric metrics looks like this:
Summary
It’s time to move on and say goodbye to static performance measurement. Provided that you are not a developer and SEO inhabiting one mind (scarier!), you will probably need to cooperate closely with the technical people involved in the project. It’s even better to leave most of the optimization to them, giving them just an idea of what is important from the SEO point of view, than stick to the old approach.
Don’t trust every tool you find on the internet, because it may do more harm than good. Familiarize yourself with Chrome DevTools, as well as Google Lighthouse, to find the common language with the people working on the code. When introducing Lighthouse 2.0, Googlers said: “As the web continues to evolve, Lighthouse will adopt these [latest and greatest] best practices,” which means these are practices you want to follow in order to provide the best value for your customers or yourself.
If you are curious for more information about Google Lighthouse, check out my review of its new SEO audit.